Recap: simple linear regression
Lab 5
John Zito
Duke University
STA 199 Spring 2025
2025-03-17
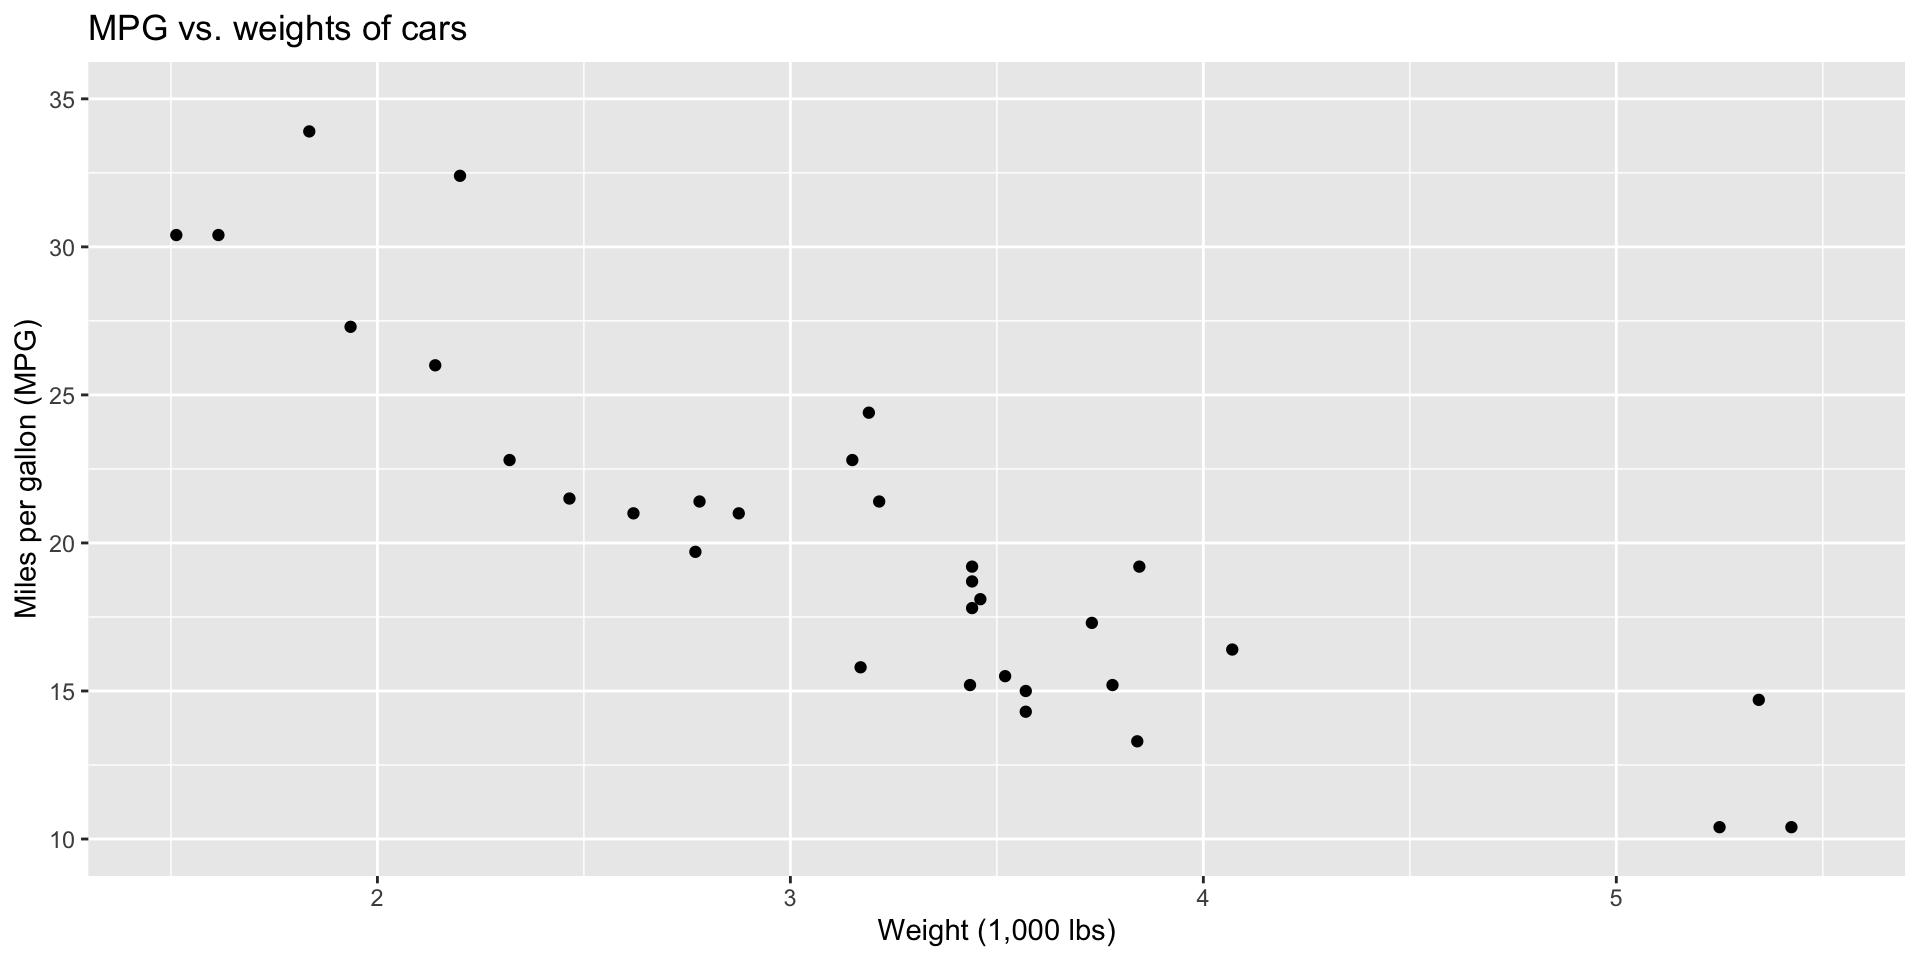
Simple linear regression
Question: how do we concisely summarize the association between two variables?
Answer: simple linear regression!
Answer: simple linear regression!
# A tibble: 2 × 5
term estimate std.error statistic p.value
<chr> <dbl> <dbl> <dbl> <dbl>
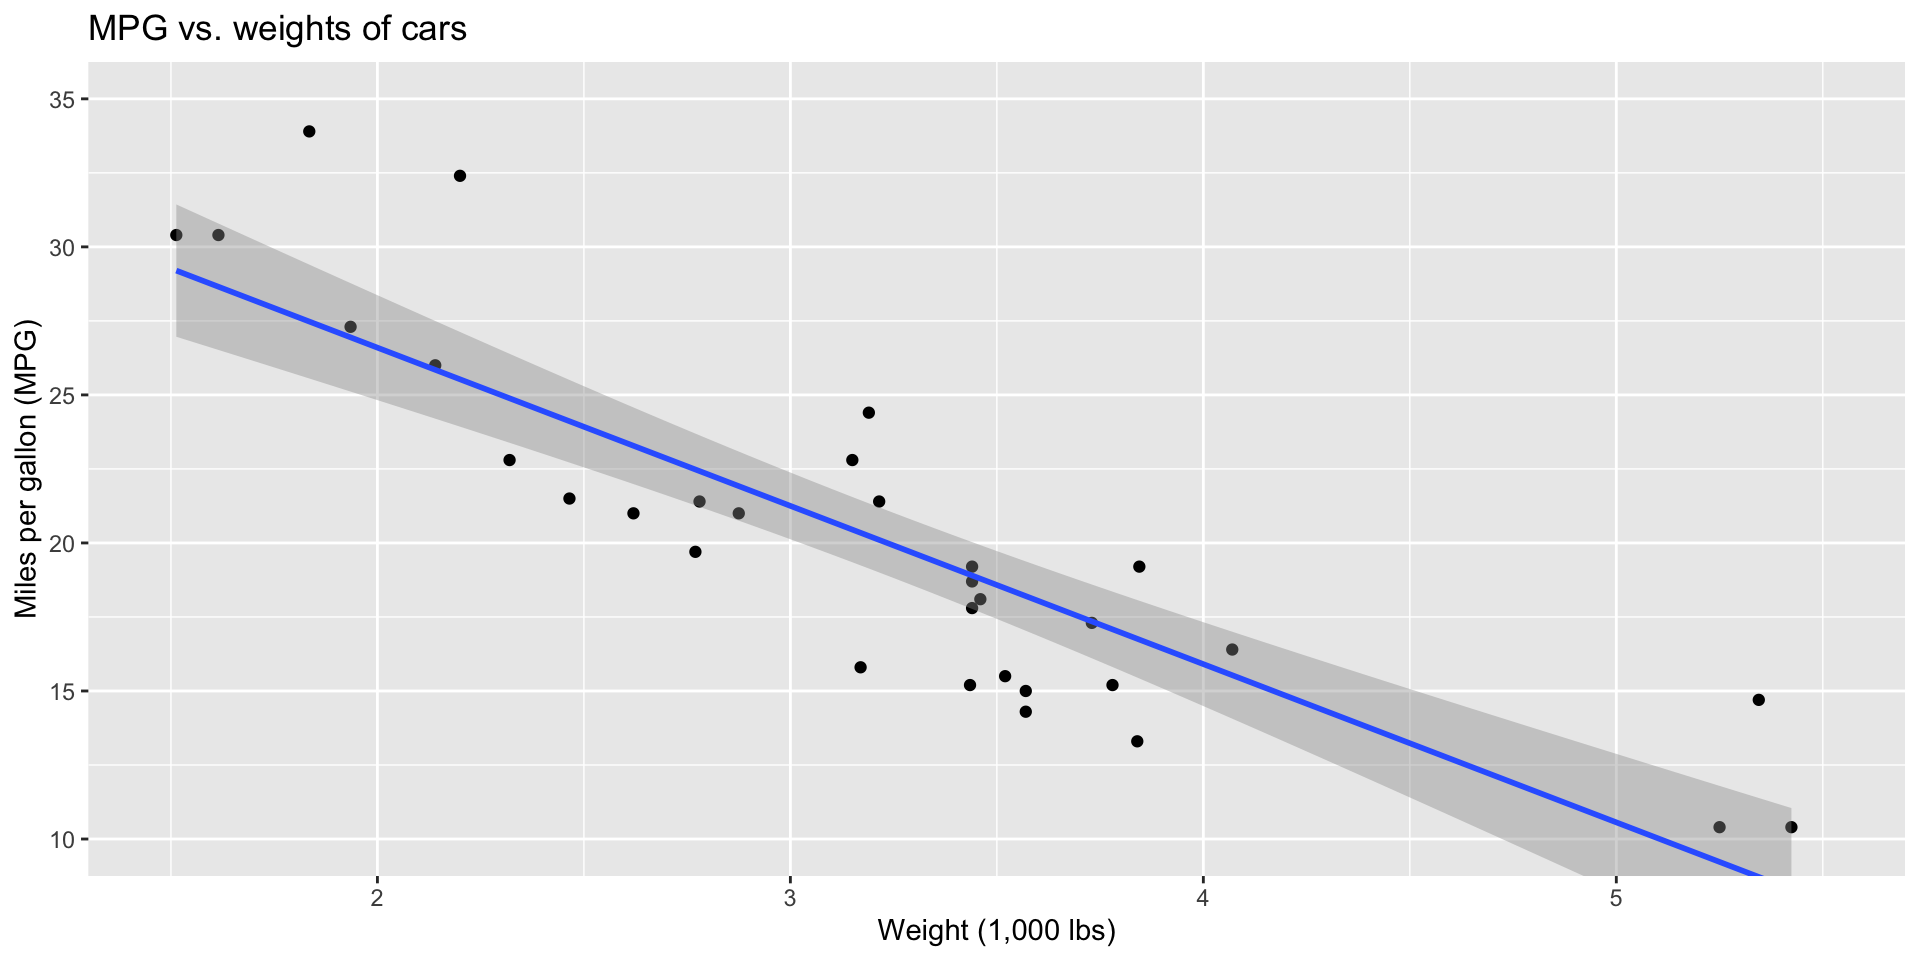
1 (Intercept) 37.3 1.88 19.9 8.24e-19
2 wt -5.34 0.559 -9.56 1.29e-10\[ \widehat{mpg}=37.3 - 5.34\times weight. \]
Interpretations
- We predict that a car weighing zero pounds will have 37.28 MPG on average (makes no sense);
- We predict that a 1000 pound increase in weight in associated with a 5.34 decrease in MGP, on average.
Why do we care? Prediction!
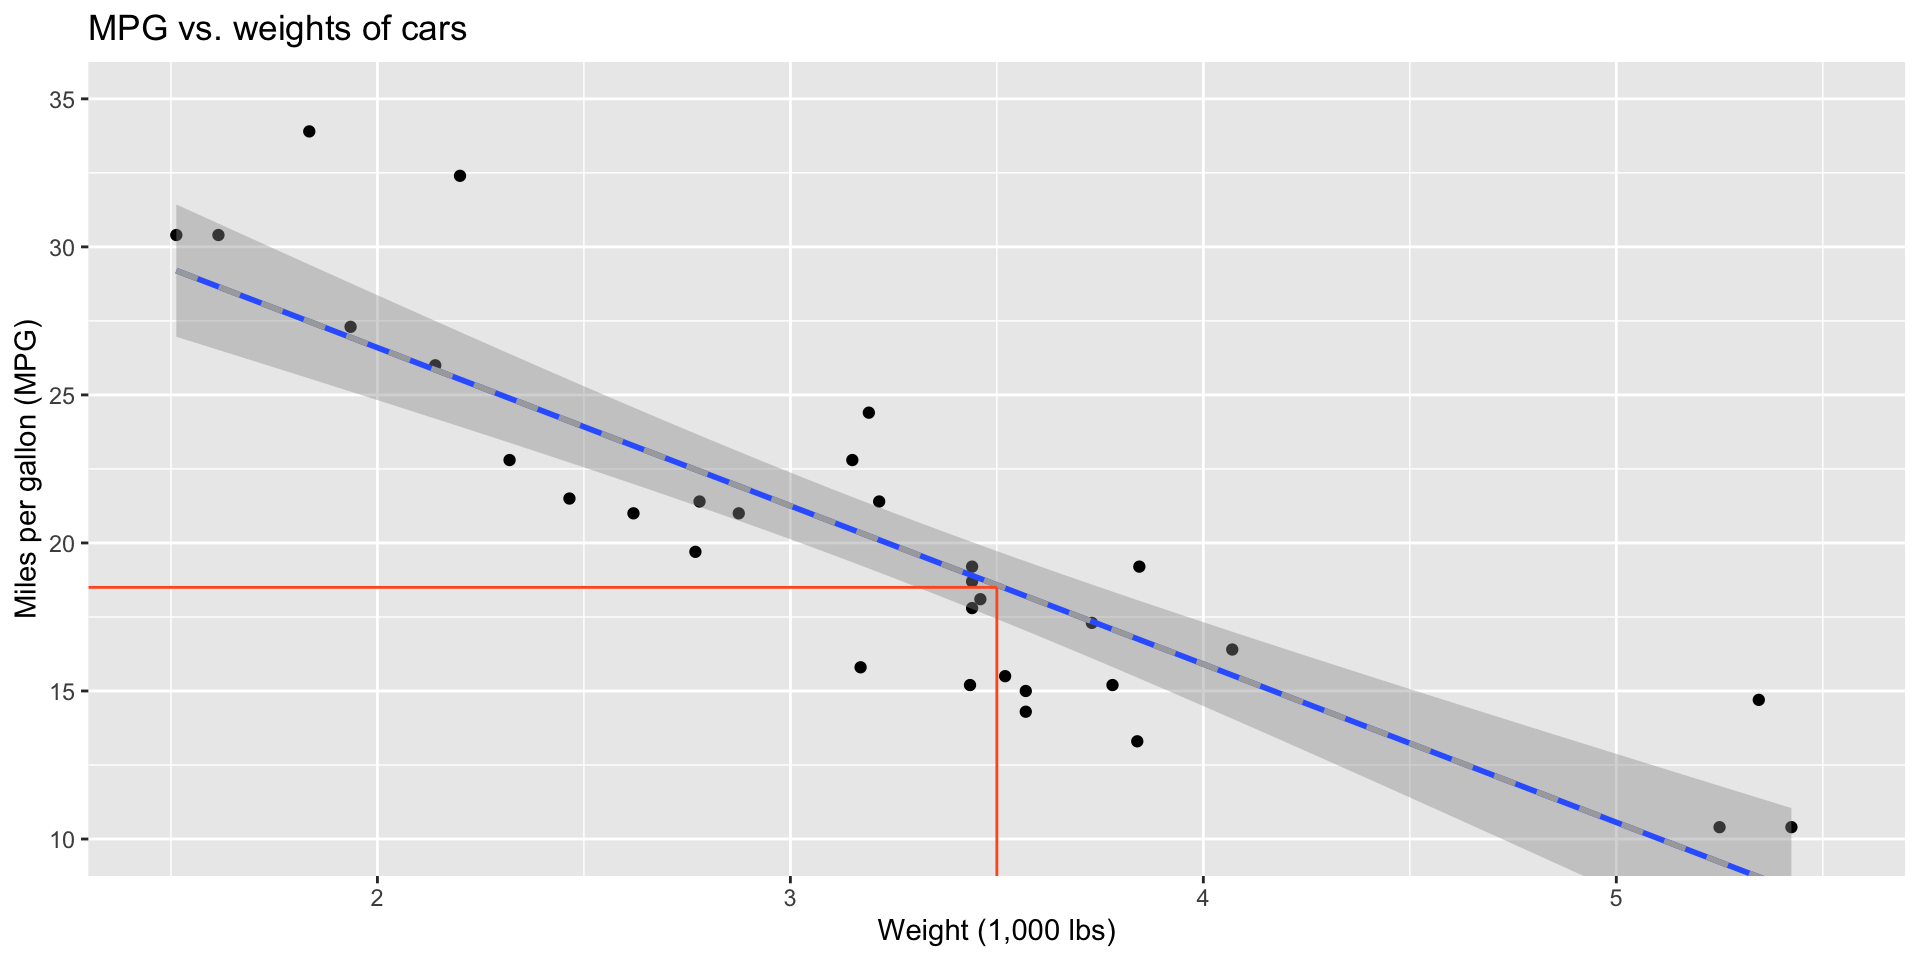
Why do we care? Prediction!
You can use the fitted model to generate predictions for yet-to-be-observed subjects:
Part 1 of today’s lab…
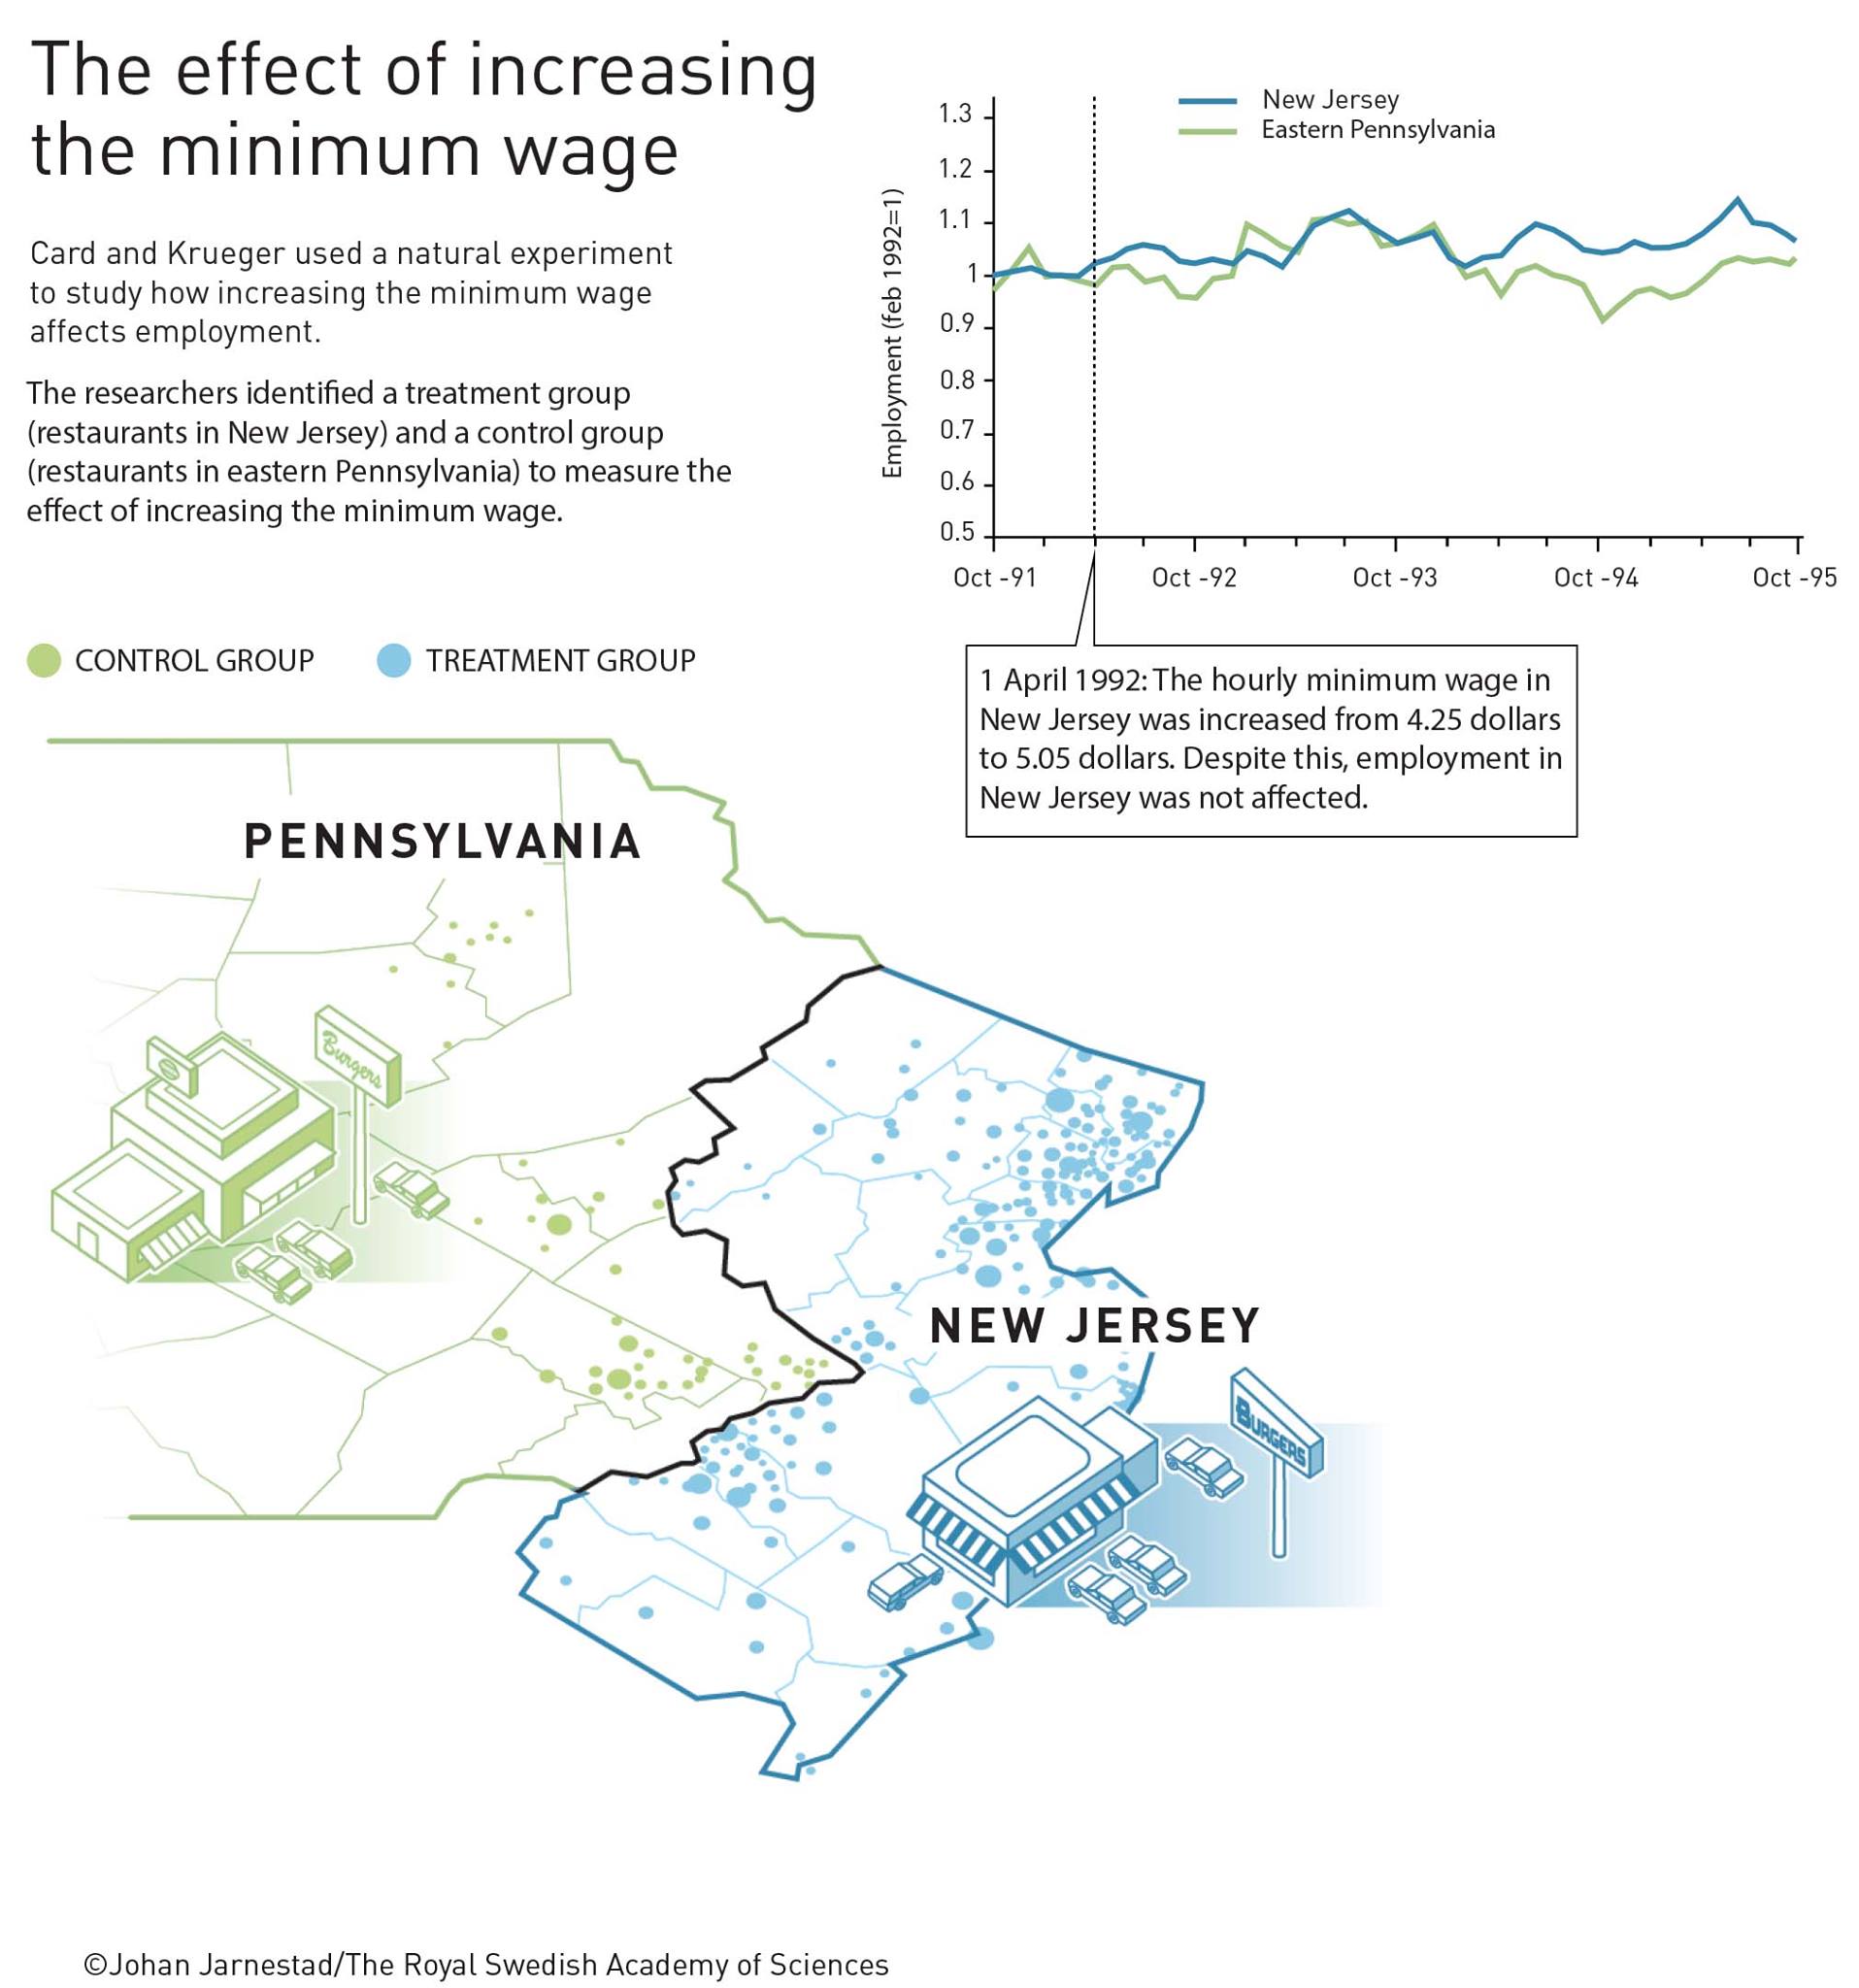
Does increasing the minimum wage decrease employment?
This is a hotly debated question in economics and public policy;
ECON 101 logic says that it might: if you make something more expensive (employing people), people do less of it.
What do the actual data say?
Classic study: Card and Krueger (1994 AER)
In 1992, NJ raised minimum wage. PA did not;
Fast-food restaurants along the NJ/PA border are probably very similar. Maybe the only difference is the change in wage policy;
So PA is like control and NJ is like the treatment;
If we compare employment before and after the policy change, maybe we can give the observed differences a causal interpretation. The increase in minimum wage caused employment to go up, down, or stay the same;
This is called a natural experiment. It’s a kind of observational study where you get very lucky and “nature” does the experimental control for you.
Classic study: Card and Krueger (1994 AER)