AE 03: Gerrymandering + data exploration I
Suggested answers
These are suggested answers. This document should be used as a reference only; it’s not designed to be an exhaustive key.
Getting started
Packages
We’ll use the tidyverse package for this analysis.
Data
The data are available in the usdata package.
glimpse(gerrymander)Rows: 435
Columns: 12
$ district <chr> "AK-AL", "AL-01", "AL-02", "AL-03", "AL-04", "AL-05", "AL-0…
$ last_name <chr> "Young", "Byrne", "Roby", "Rogers", "Aderholt", "Brooks", "…
$ first_name <chr> "Don", "Bradley", "Martha", "Mike D.", "Rob", "Mo", "Gary",…
$ party16 <chr> "R", "R", "R", "R", "R", "R", "R", "D", "R", "R", "R", "R",…
$ clinton16 <dbl> 37.6, 34.1, 33.0, 32.3, 17.4, 31.3, 26.1, 69.8, 30.2, 41.7,…
$ trump16 <dbl> 52.8, 63.5, 64.9, 65.3, 80.4, 64.7, 70.8, 28.6, 65.0, 52.4,…
$ dem16 <dbl> 0, 0, 0, 0, 0, 0, 0, 1, 0, 0, 0, 0, 1, 0, 1, 0, 0, 0, 1, 0,…
$ state <chr> "AK", "AL", "AL", "AL", "AL", "AL", "AL", "AL", "AR", "AR",…
$ party18 <chr> "R", "R", "R", "R", "R", "R", "R", "D", "R", "R", "R", "R",…
$ dem18 <dbl> 0, 0, 0, 0, 0, 0, 0, 1, 0, 0, 0, 0, 1, 1, 1, 0, 0, 0, 1, 0,…
$ flip18 <dbl> 0, 0, 0, 0, 0, 0, 0, 0, 0, 0, 0, 0, 0, 1, 0, 0, 0, 0, 0, 0,…
$ gerry <fct> mid, high, high, high, high, high, high, high, mid, mid, mi…Since this dataset is shipped with a package, it has documentation that you can access via ?gerrymander. The flip18 variable is categorical with three levels:
- -1: control of the district flipped from Democrats to Republicans between 2016 and 2018;
- 0: the district did not flip. If Democrats controlled it in 2016, they kept it in 2018. If Republicans controlled it in 2016, they kept it in 2018;
- 1: control of the district flipped from Republicans to Democrats between 2016 and 2018.
Districts at the tails
Make side-by-side box plots of percent of vote received by Trump in 2016 Presidential Election by prevalence of gerrymandering. Identify any Congressional Districts that are potential outliers. Are they different from the rest of the Congressional Districts due to high support or low support for Trump in the 2016 Presidential Election? Which state are they in? Which city are they in?
ggplot(gerrymander, aes(x = trump16, y = gerry)) +
  geom_boxplot() +
  labs(
    x = "% vote for Trump in 2016",
    y = "Extent of gerrymandering in district"
  )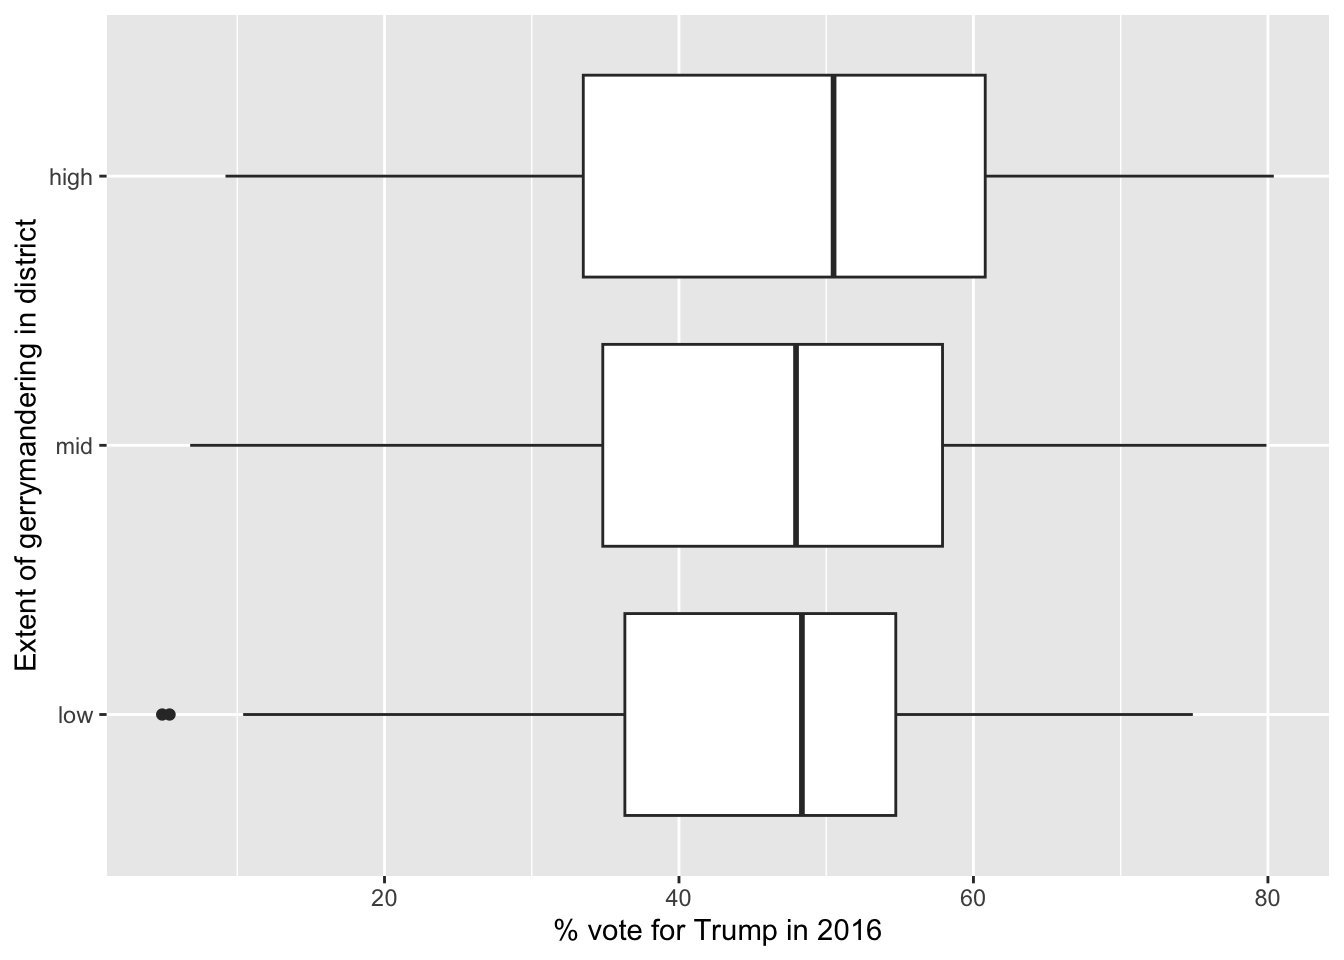
The outliers are:
gerrymander |>
  filter(gerry == "low" & trump16 < 10)
# A tibble: 2 × 12
district last_name first_name party16 clinton16 trump16 dem16 state party18
<chr> <chr> <chr> <chr> <dbl> <dbl> <dbl> <chr> <chr>
1 NY-13 Espaillat Adriano D 92.3 5.4 1 NY D
2 NY-15 Serrano Jose D 93.8 4.9 1 NY D
# ℹ 3 more variables: dem18 <dbl>, flip18 <dbl>, gerry <fct>Flips
Is a Congressional District more likely to have high prevalence of gerrymandering if a Democrat was able to flip the seat in the 2018 election? Support your answer with a visualization as well as summary statistics.
Calculate the conditional distribution of prevalance of gerrymandering based on whether a Democrat was able to flip the seat in the 2018 election.
This code gives you a bar chart counting how many districts fall into each level of flip18, and then divides each bar according to the prevalence of gerrymandering in the districts:
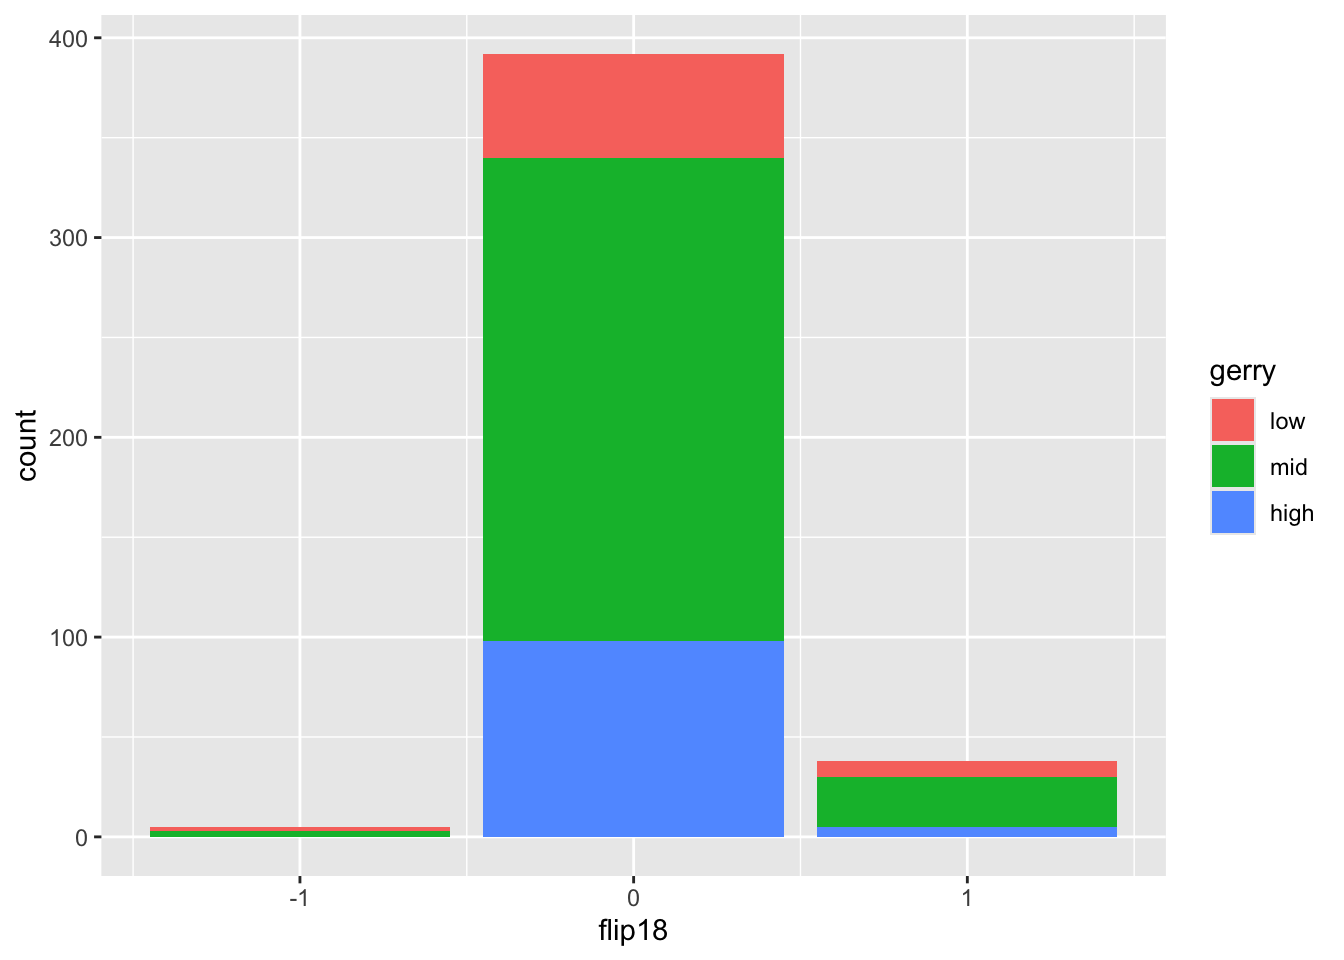
However, because the total number of counts is different in the three groups, it’s hard to directly compare the information about gerrmandering. So, this code normalizes each bar so that you can compare by eye:
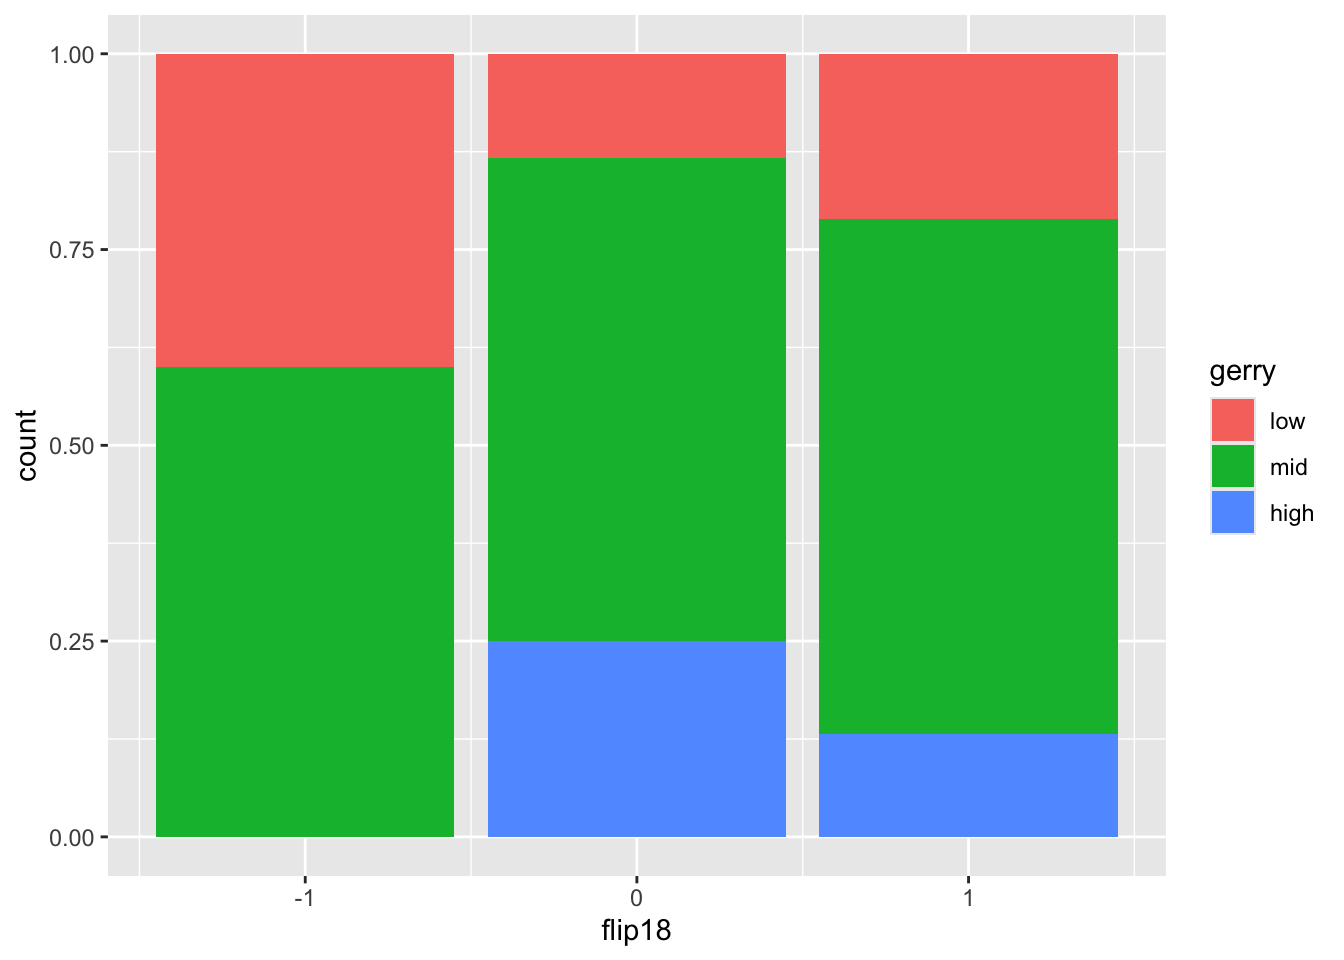
This code gives you the raw numbers that underpin the plot:
# A tibble: 8 × 4
# Groups:   flip18 [3]
  flip18 gerry     n  prop
   <dbl> <fct> <int> <dbl>
1     -1 low       2 0.4
2     -1 mid       3 0.6
3      0 low      52 0.133
4      0 mid     242 0.617
5      0 high     98 0.25
6      1 low       8 0.211
7      1 mid      25 0.658
8      1 high      5 0.132
Based on this information, which party would you say benefited from gerrymandering more in the 2018 midterms?
Render, commit, and push
Render your Quarto document.
Go to the Git pane and check the box next to each file listed, i.e., stage your changes. Commit your staged changes using a simple and informative message.
Click on push (the green arrow) to push your changes to your application exercise repo on GitHub.
Go to your repo on GitHub and confirm that you can see the updated files. Once your updated files are in your repo on GitHub, you’re good to go!